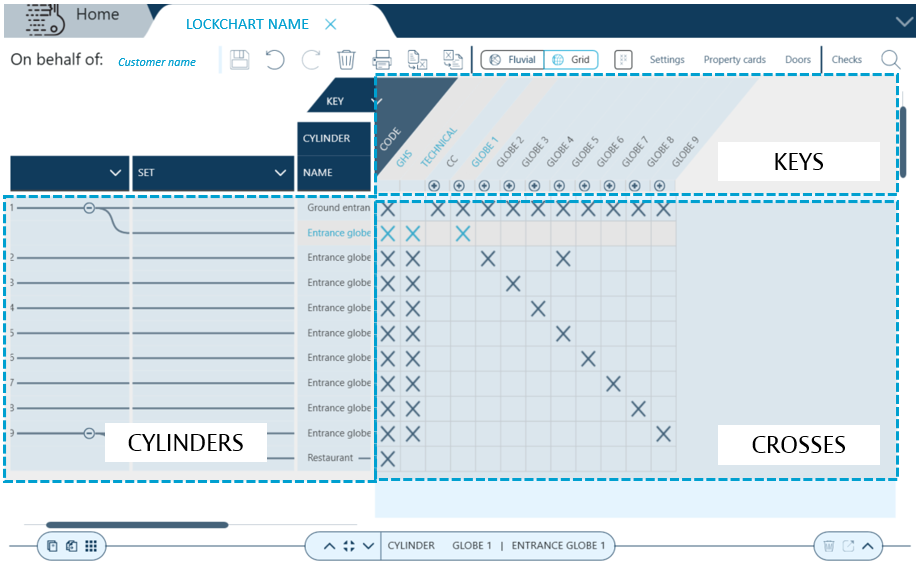
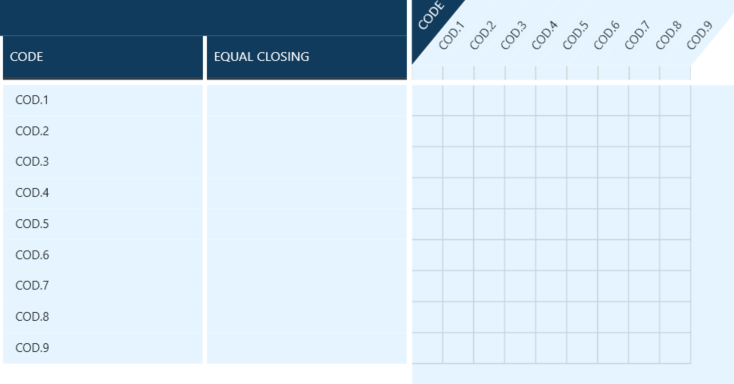
When the screen is opened for the first time it can look as follows, where majority of space is taken by the lockchart itself.
 .
.
Lockcharts represent lists of cylinders and keys that are able to open them with crosses indicating correlation.
Depending on the complexity of the project lockcharts can substantially grow and the list of fields displayed for cylinders and keys can grow as well.
Cylinders
Cylinders list, organized into sets, groups is displayed on the left-hand side. Cylinders are available in this area both in Grid and in Fluvial view.
Each row represents a cylinder.
When a new lockchart is created without a predefined list of levels in hierarchy only one row is displayed.
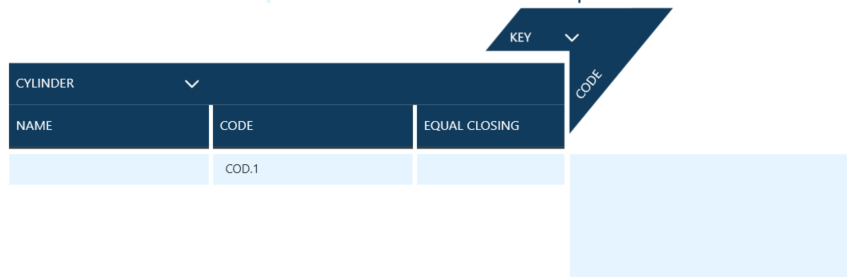
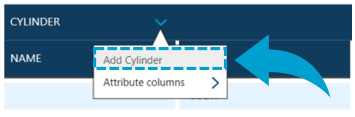
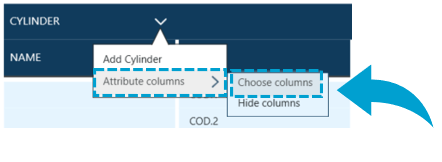
To add cylinders to the lockchart users click on the downward arrow and select Add Cylinder.
Pop-up window appears asking users to select number of cylinders to be added.
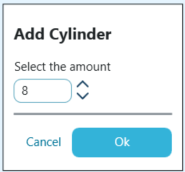
Once the amount has been selected new rows appear. Key Studio™ automatically creates new codes with incrementing numbers to distinguish cylinders.
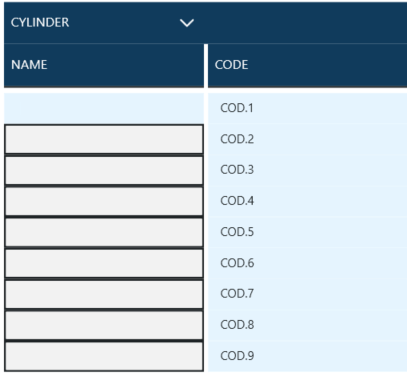
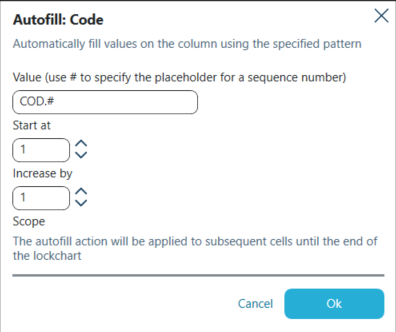
Users can set the rules for auto-fill coding logic by clicking on a Code on the list and selecting Auto-fill.
Configuration pop-up window appears where the rules can be modified from default ones.
Users can alter the name of the cylinder by double clicking in a chosen cell.
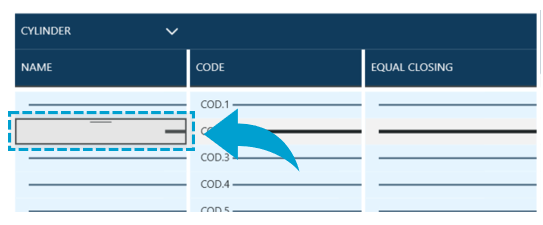
Names can be set to any value as set by the user.
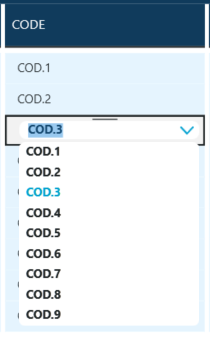
Codes can also be set to a value typed by the user.
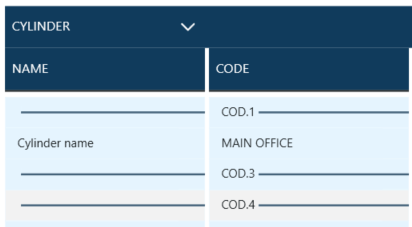
As cylinders can be coded in an identical manner users can also pick code name from a list - the value of another.
CYLINDER COLUMNS
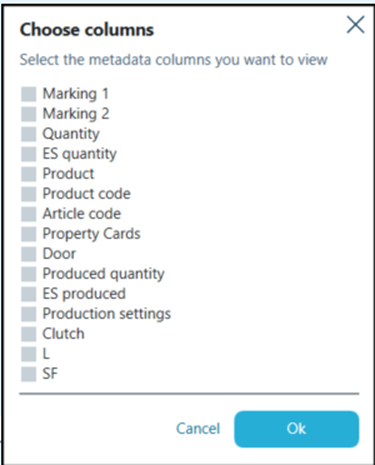
Key Studio™ offers a wide range of fields that can be added to cylinder visualization.
In order to add them to the lockchart users click on the downward arrow at the top of cylinder pane and choose Attribute columns -> Choose columns.
Pop-up window appears which allows column selection. After clicking OK chosen columns appear within the visualization.
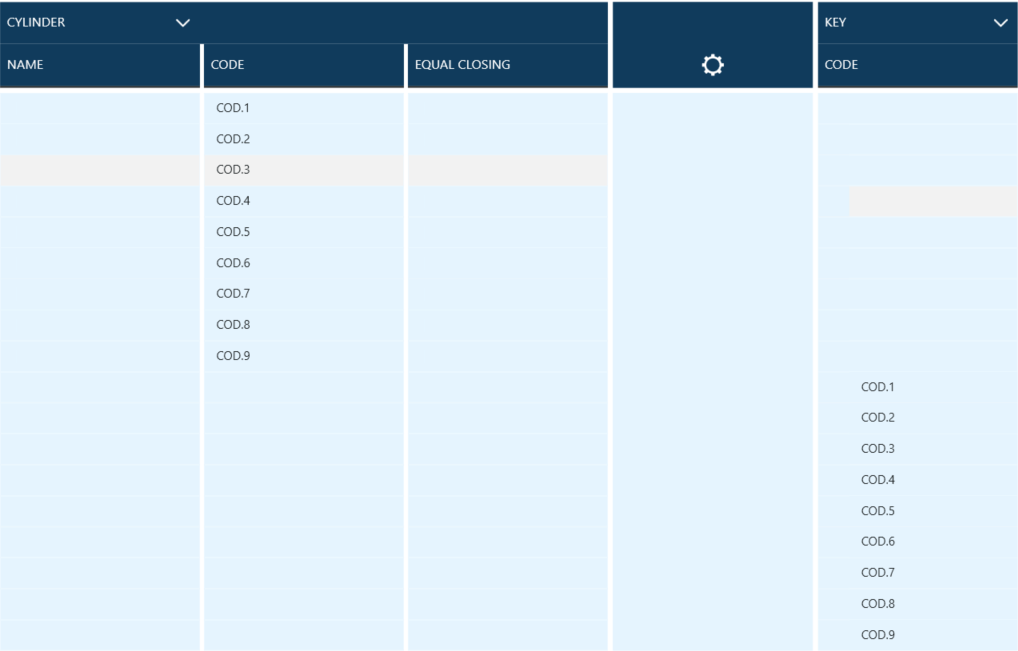
Keys
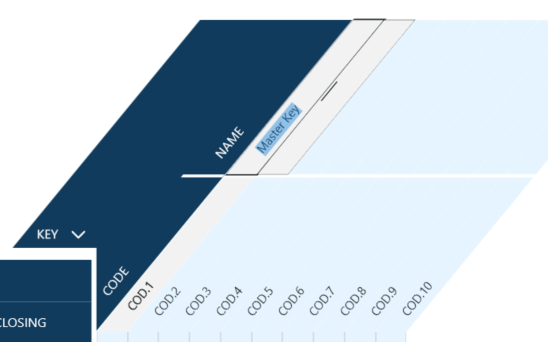
Keys list is displayed on the top of the lockchart in Grid view and on the right-hand side in Fluvial view.
Each column represents a key.
When a new lockchart is created without a predefined list of levels in hierarchy no keys are displayed. They need to be added by the users.
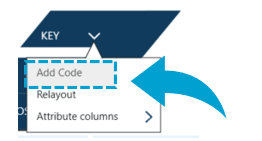
To add keys to the lockchart users click on the downward arrow and select Add Code.
Pop-up window appears asking users to select number of keys to be added.
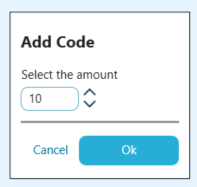
Once the amount has been selected new columns appear. Key Studio™ automatically creates new codes with incrementing numbers to distinguish keys.
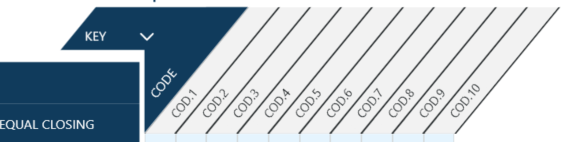
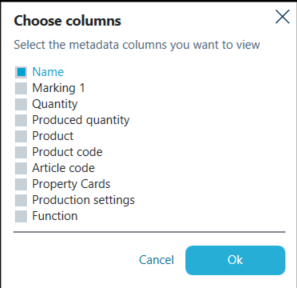
By default only Key Codes are displayed within the lockchart visualization. To add additional fields, for example Name users need to modify the view and select columns to be displayed.
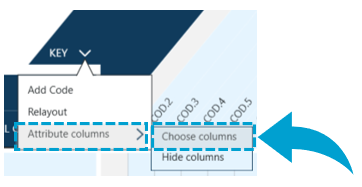
Pop-up window appears which allows column selection. After clicking OK chosen columns appear within the visualization.
Once the columns have been chosen they can be shown / hidden by clicking on Attribute columns -> Show columns or Attribute columns -> Hide columns.
Users can alter the name of the key by double clicking in a cell.
To add another key with the same coding users right-click on an existing key and select Add key.
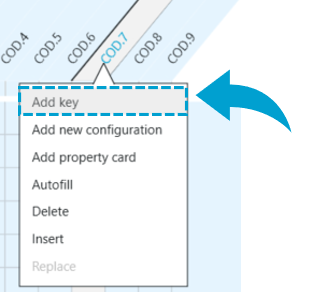
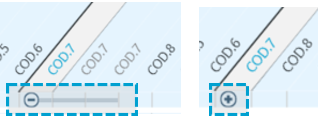
New key appears on the list with the same code. Keys are visually grouped. By clicking on - / + icons keys belonging to a group can be hidden or displayed.
Crosses / lines
When the cylinders and keys have been added to the lockchart empty grid is displayed.
Navigate to Grid view to learn about details of managing cylinder - key connection in Grid display.
In Fluvial view keys are displayed underneath cylinders before any matches are made.
Navigate to Fluvial view chapter to learn about managing cylinder - key connections in Fluvial view mode.